Automation Log Search
Automations send emails, post to Teams, push messages to queues, call webhooks and build smart curves whenever your data changes. When someone says "I never got the email" or "the risk system did not get today's curve", you need to see what the automations actually did. The Automation Log Search report lists every automation log entry in a date range, across all items, and answers questions like:
- Did the automations run yesterday evening, and did they succeed?
- Which deliveries failed this week, and with what message?
- Has the webhook to the risk system been returning errors?
- Which smart curve builds were triggered today?
At Northgate Energy, Priya Shah uses it each morning to check that the overnight emails, queue messages and smart curve builds all went through.
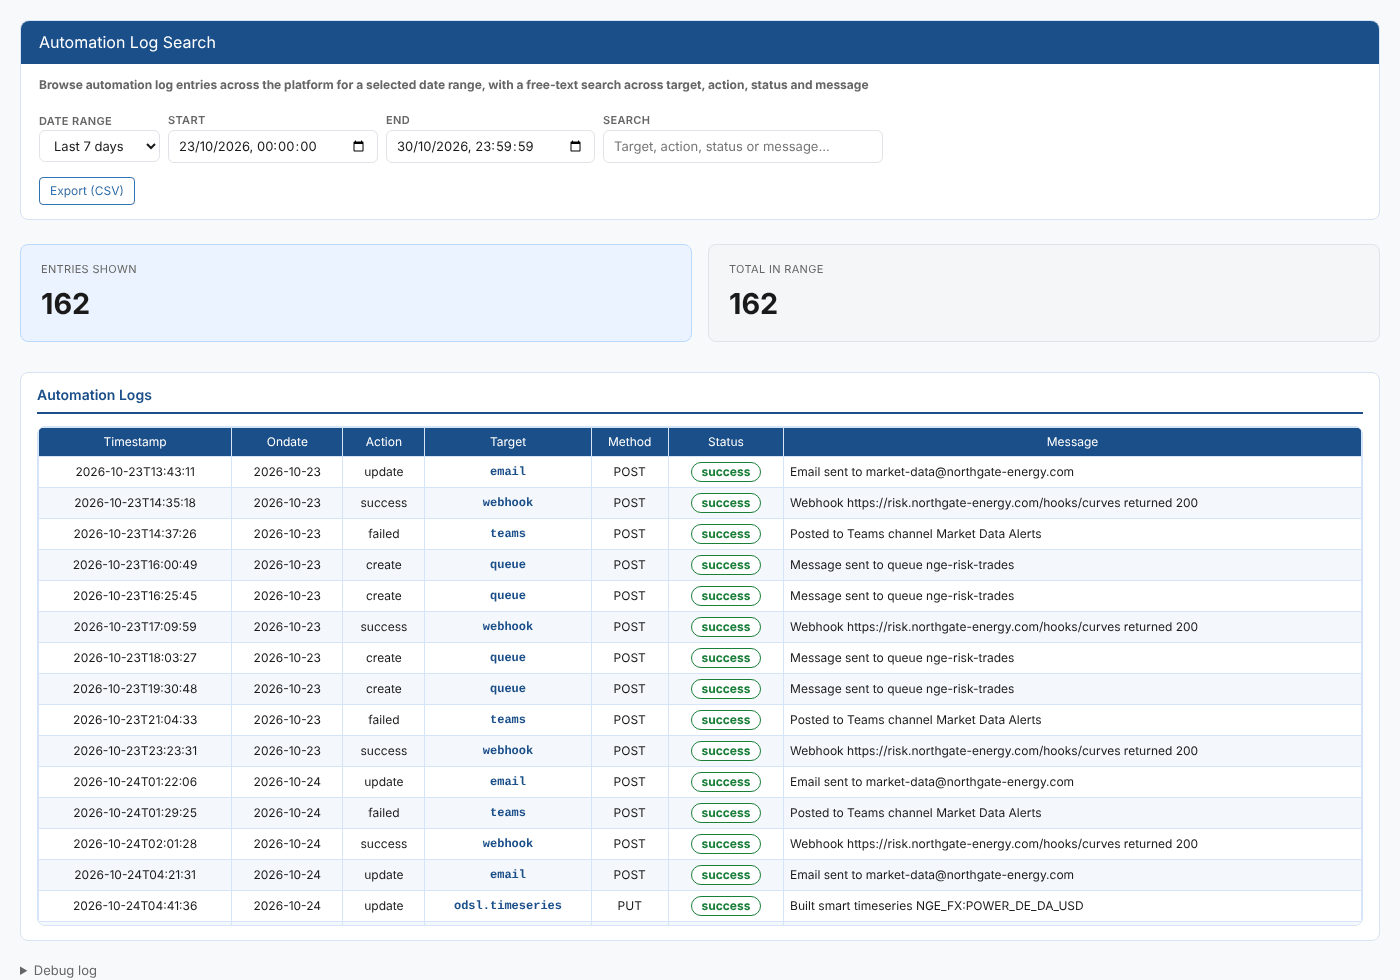
Opening the report
The report is in the Reports menu, in the Automations category, as Automation Log Search (report id #AUTOMATION_LOG_SEARCH). It is a public report, so it is available in every tenant.
Unlike the Automation Logs item insight, it is not limited to one item: it reads the automation log for the whole platform. When it opens it loads the entries for Today.
| Control | What it does |
|---|---|
| Date range | Today, Yesterday, Last 7 days, Last 30 days, Last 60 days, This month, Last month or All. Choosing one fills in Start and End and reloads the list. |
| Start, End | Override the range with your own dates and times. Leave one empty for an open-ended range. |
| Search | Shows only the loaded entries whose target, action, status or message contains the text you type (any case). It filters as you type and does not reload. |
| Export (CSV) | Downloads the rows on screen, after the search, as automation-logs.csv |
| Debug log | At the bottom of the page: the range used and how many entries were returned |
The report
Cards
| Card | What it shows |
|---|---|
| Entries shown | The rows on screen after the search |
| Total in range | The entries loaded for the date range, before the search |
Automation Logs table
| Column | What it shows |
|---|---|
| Timestamp | When the automation ran |
| Ondate | The date of the data the automation acted on |
| Action | The action that triggered it, such as create, update, success or failed |
| Target | The automation target, such as email, queue, webhook, teams or odsl.curve |
| Method | How the target was called, such as POST or PUT |
| Status | A green badge for success, red for failed or error, amber for anything else |
| Message | What happened, for example the email address, the queue name or the error returned |
Searching
Type in Search to find entries without reloading. The text is matched against the target, action, status and message, so timed out finds every delivery that timed out, and webhook finds every webhook call.
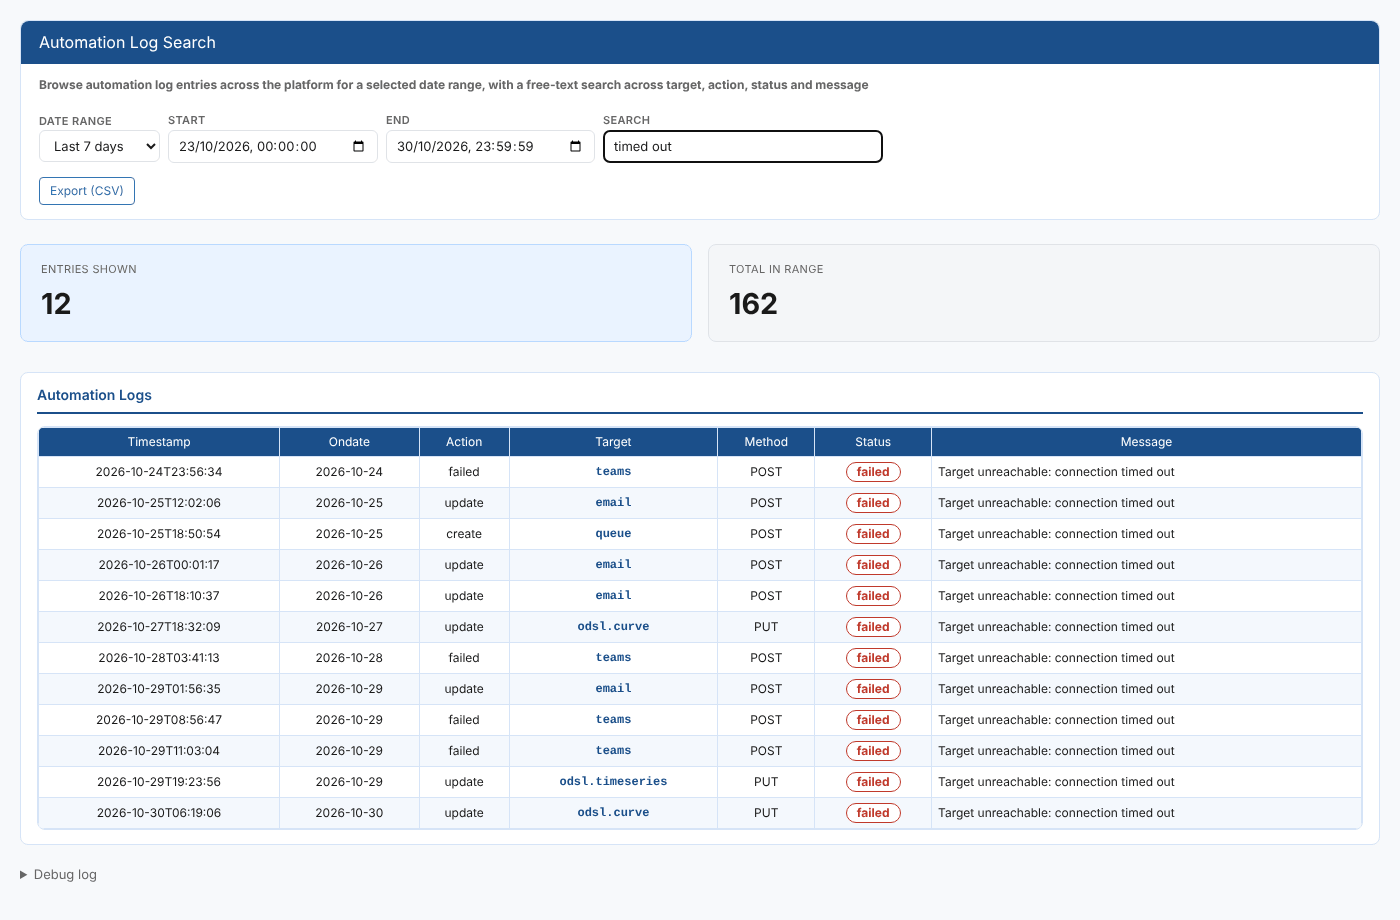
The search only looks at the entries already loaded for the date range. The report loads up to 10,000 entries, and Total in range counts what was loaded, so for a very busy platform choose a shorter range.
Troubleshooting
| Problem | What to do |
|---|---|
| No automation log entries fall in the selected range. | Nothing ran in that range. Try Last 7 days, or check the automations exist with the Automations item insight. |
| No entries match the search text. | Clear or shorten the search text. |
| Rows are not in time order | The list is shown in the order the platform returns it. Export to CSV and sort there if you need it in order. |
Related
- Automation Logs: the automation log for one item
- Automations: the automations set up on an item
- Process Execution Insights: process runs, including the automations each run triggered
- Insights: how insight reports work