Data Report
Before you use a timeseries or curve you often want the basics: where it comes from, its units and timezone, and how far back the data goes. The Data Report lists all of that for one item and answers questions like:
- Which event list and which property does this event timeseries read, and with what filter?
- What are its units, currency, calendar and timezone?
- When does the data start and end?
- What are the lowest and highest values?
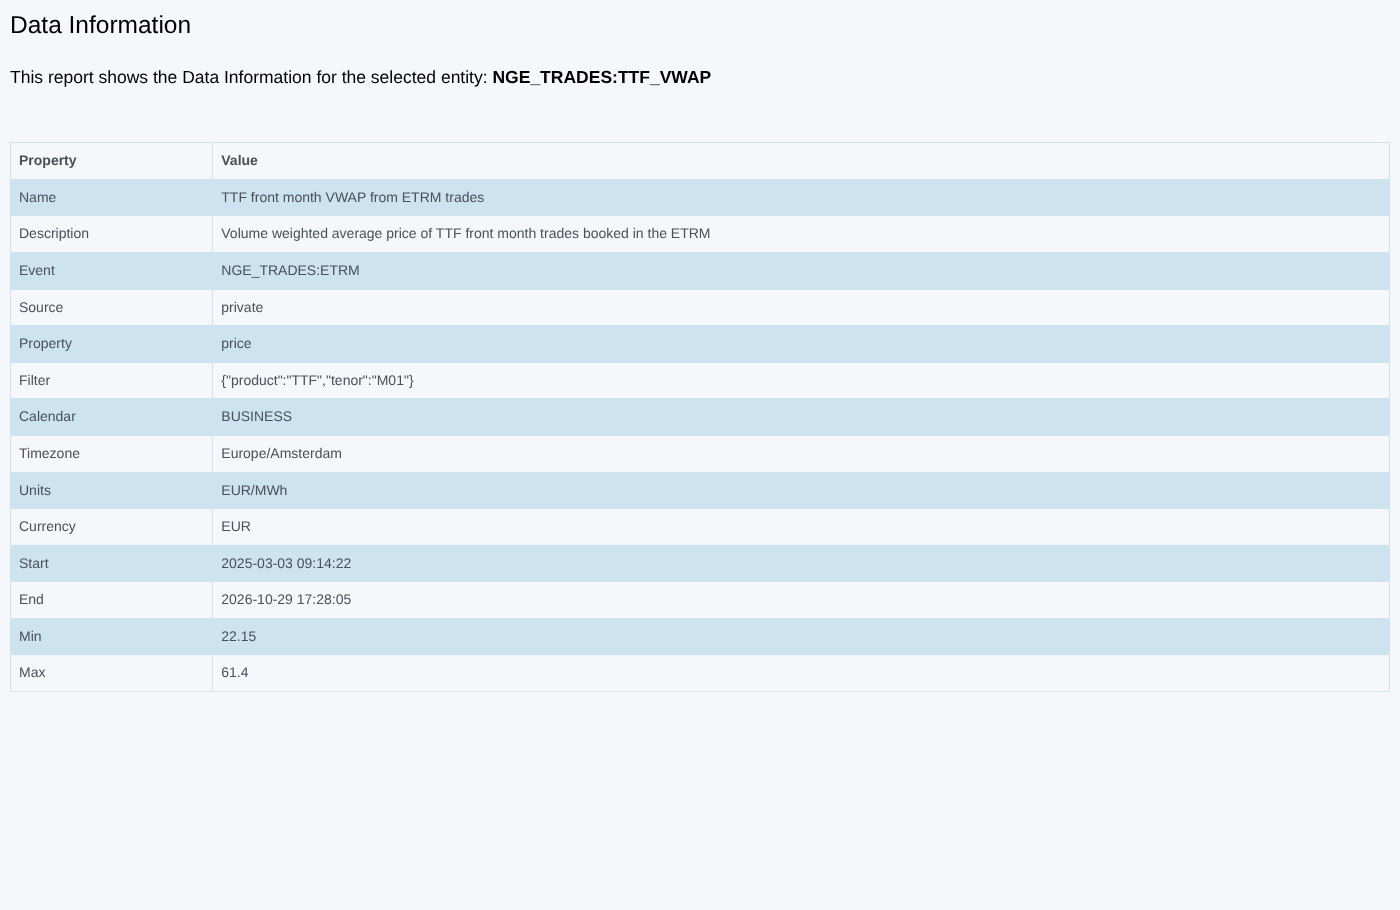
At Northgate Energy, Priya Shah opens it on NGE_TRADES:TTF_VWAP, the TTF front month VWAP built from ETRM trades, to check which trades it uses and how much history it has.
Opening the report
The report works on one item, so you open it from the item's insights. It is registered as Data Report (#INSIGHT_ITEM_DATA) in the Data Insights category, hidden from the Reports list. The same registration is in both the Generic and the Item report scripts.
It reads the item's definition (without its data) as soon as it opens. There are no controls.
The report
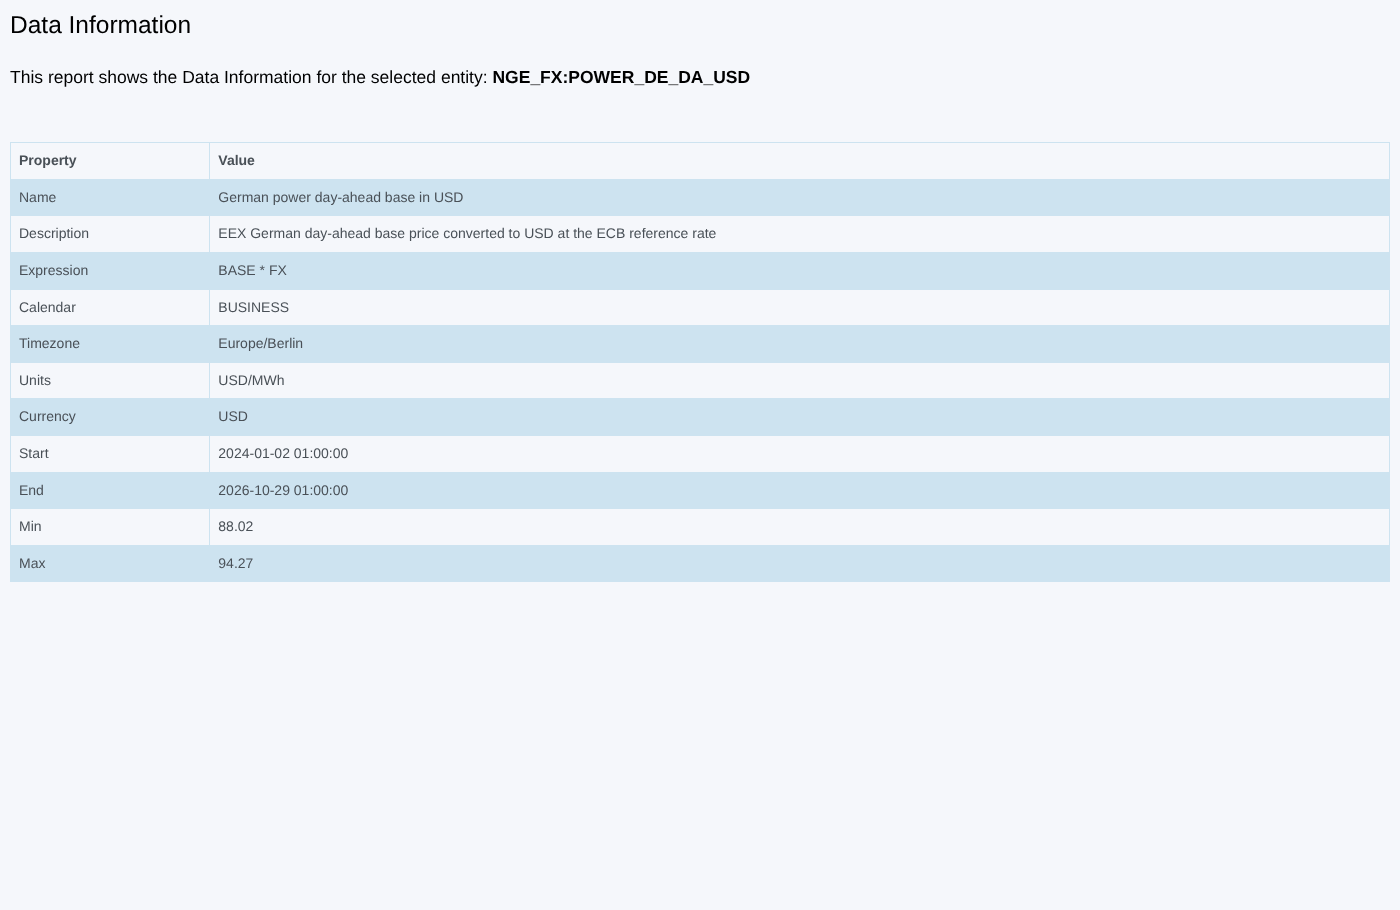
The header names the item. The table has one row for each field of the item's definition, with the field name capitalised in Property and its value in Value. Platform fields (those starting with an underscore) and the item's properties, data, contracts and ondate are left out.
For some types the report works out extra rows:
| Item type | Extra rows | How they are found |
|---|---|---|
| Event timeseries | Start, End, Min, Max | From the events in the item's event list that match its filter: the first and last event start time, and the lowest and highest value of the item's property |
| Event curve | Start, End, Min, Max | As above, using the event time |
| Smart timeseries | Start, End, Min, Max | From the built timeseries: its first and last date and its lowest and highest value |
Start and end are shown in the item's timezone, as yyyy-mm-dd hh:mm:ss.
Values that are objects (for example a nested setting) are shown as [object Object]. Open the item itself to see those.
Related
- Seasonality Chart
- Event Analysis: analyse the events behind an event timeseries or curve
- Curve Dependency Report
- Insights: how insight reports work