Curve Quality Report
Curve Management puts curves into quality groups so that related curves are checked together. The Curve Quality Report shows which curves are in each quality group and answers questions like:
- Which quality groups do we have?
- Which curves are checked in the end-of-day gas group?
- Is a new curve in the right quality group?
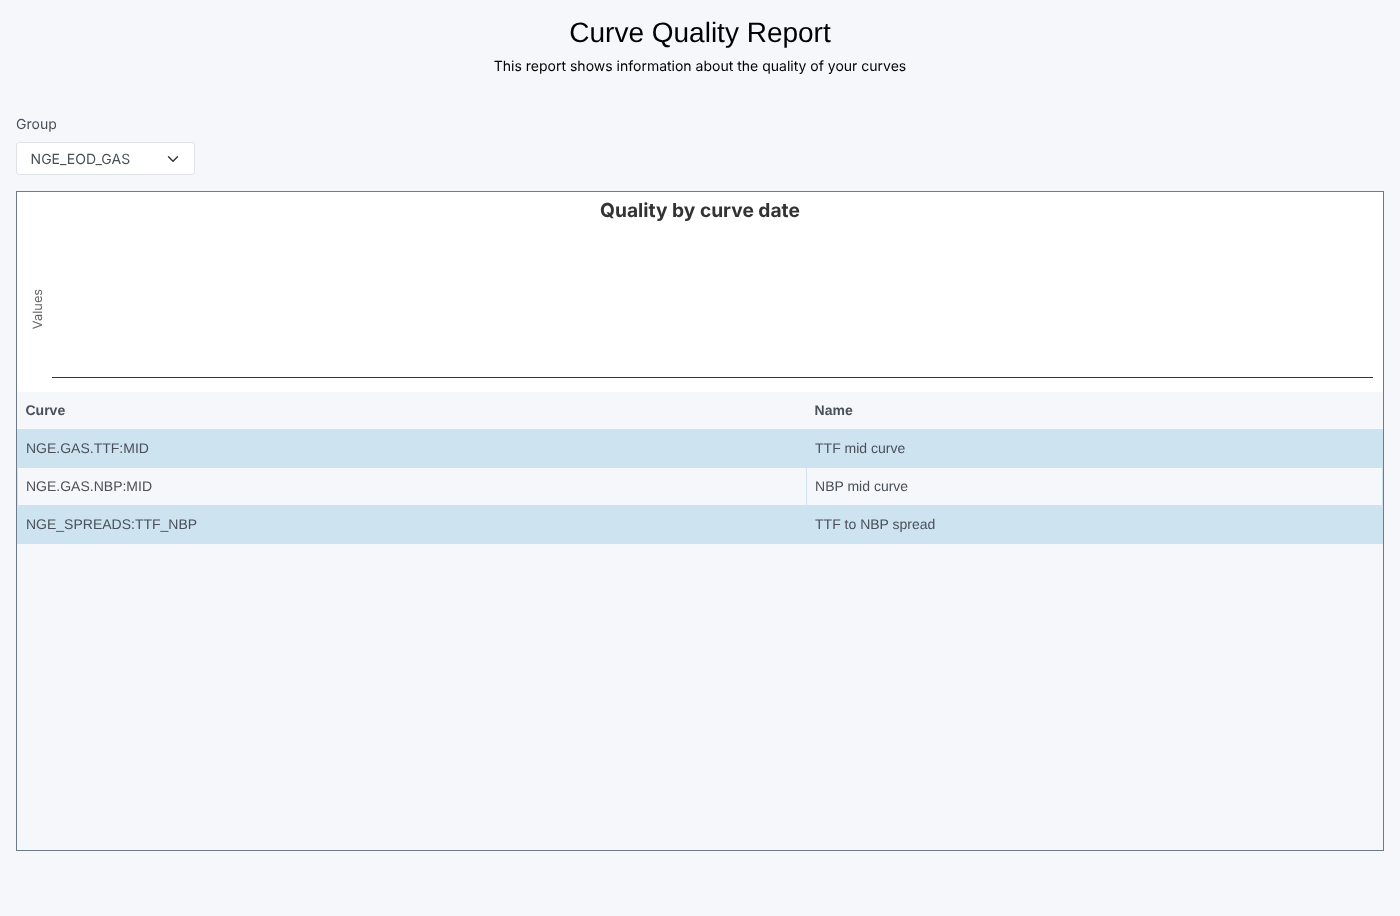
At Northgate Energy, Priya Shah checks that the TTF and NBP mid curves and the TTF to NBP spread are all in the NGE_EOD_GAS group.
Opening the report
The report is registered as Curve Quality Report (#INSIGHT_CM_QUALITY) in the Curve Management category. It is hidden from the Reports list (hideList), so it is opened from Curve Management rather than from the Reports menu.
When it opens it reads your quality groups (groups of type quality), selects the first one and lists its curves.
| Control | What it does |
|---|---|
| Group | The quality group to show. Changing it lists that group's curves. |
The report
| Part | What it shows |
|---|---|
| Quality by curve date chart | A column chart area for curve quality by curve date. In the current version of the report the chart is not filled in, so it stays empty. |
| Curve table | One row per curve in the selected group: Curve (the curve id) and Name |
This is an older style report. It uses chart and style partials (#highcharts_lib) that are kept on the platform rather than with the other report scripts.
Related
- Curve Hierarchy Report
- Curve Dependency Report
- Insights: how insight reports work